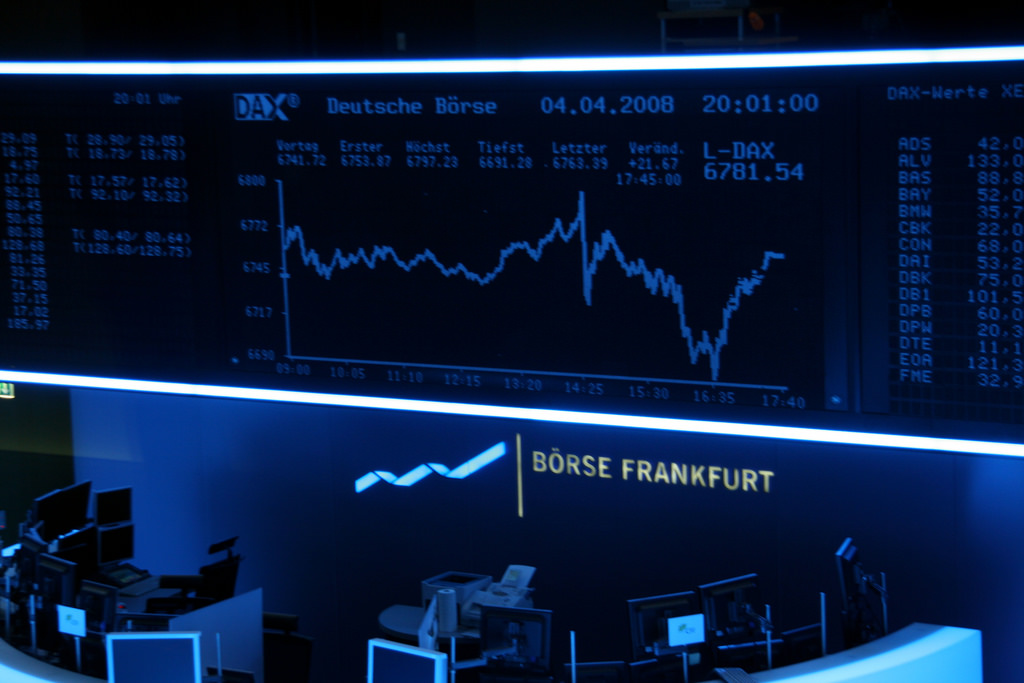
It is no secret when it comes to successful trading that you need a strategy and part of that strategy is ‘the trend is your friend’, which can be used to your advantage.
What’s the real story?
Identifying an existing stock market trend can be done relatively easily, although there are no guarantees, the profit probability is generally greater than predicting a new one. The trend is your friend is a classic pearl of wisdom when it comes to trading and worthy of your attention.
By observing the ‘trend’ you get a full picture of how the market is driven as a whole and not get caught up in the day-to-day volatility of short-term fluctuations.
How can you identify a trend?
To identify a trend, you will need to take a step back and look at the bigger picture. You will notice very quickly that prices constantly fluctuate, but over time you will easily notice that the market moves in a general direction.
Now, it might be in an uptrend or a downtrend, usually the steeper a trend is, the shorter its duration. This is where
technical analysis charts and price patterns are useful in helping you to make an educated guess.
Use of the technical analysis tool
Using the technical analysis tool to identify the moving average and direction of the trend is done over a certain period. Calculated by adding all closing prices within the period and divided by the number of days. Using candles every day and done over a period of 50 days and 200 days. Greater weight in calculations is sometimes given to more recent values.
Assessing the strength of a trend by means of the average directional index (ADX).
The ADX ranges between 0 and 100 and when there is a value above 20 you have a trend, the higher the value, the stronger the trend. When the ADX is rising it means the trend is getting stronger (ascending) or vice versa, if it is descending it is getting weaker.
To determine whether a share or commodity has been bought too much or sold too much you use the relative strength index (RSI).
The values range between 0 and 100. You will get a buy recommendation if the value is 30 or lower (oversold). The share is overbought if the value is 70 or higher and the recommendation is to sell. Now if the RSI holds its position over a certain period without a rise or fall, this could be an indication that a trend is happening.
When to buy or sell short
A dip in a trend is the best time to enter and you need to take into consideration that with a very strong trend the dips are minimal. If it is an uptrend it is a signal to buy, a downtrend you need to be short selling.
Words of wisdom
A successful trader needs to have discipline during short term fluctuations and not get too excited when there is a temporary market correction.
That’s not all …
Applying risk management to your trading strategy with a stop loss set to allow for normal movement in the trend which allows for it to bounce back and give room to breathe should be applied.
Another recommendation is to set the stop loss below the low of the most recent trough (or moving average) whichever is lower in an uptrend.
For a downtrend move the stop loss above the high of the most recent trough (or the moving average) whichever is higher.
Bottom Line?
Mastering ‘trends’ with the help of technical analysis tools pave the way to achieving successful and profitable trades.
eToro, the leading social trading CFD’s investment broker offers traders in-depth webinars and tutorials on all aspects of trading, including a free unlimited demo account where you can ‘play’ the markets with virtual money. Their platform is one of the most innovative and easy to use with professional tools even for a novice, see for yourself.
Please note that CFDs are complex instruments and come with a high risk of losing money rapidly due to leverage. 61% of retail investor accounts lose money when trading CFDs with this provider. You should consider whether you understand how CFDs work, and whether you can afford to take the high risk of losing your money.
This communication is intended for information and educational purposes only and should not be considered investment advice or investment recommendation. Past performance is not an indication of future results.
Copy Trading does not amount to investment advice. The value of your investments may go up or down. Your capital is at risk.
Crypto investments are risky and may not suit retail investors; you could lose your entire investment. Understand the risks here https://etoro.tw/3PI44nZ
eToro USA LLC does not offer CFDs and makes no representation and assumes no liability as to the accuracy or completeness of the content of this publication, which has been prepared by our partner utilizing publicly available non-entity specific information about eToro.


